Theory of Constraints TOC Blog #2 Exploit the Constraint
- Jeff Langlet
- Aug 8, 2025
- 3 min read
Updated: Aug 11, 2025
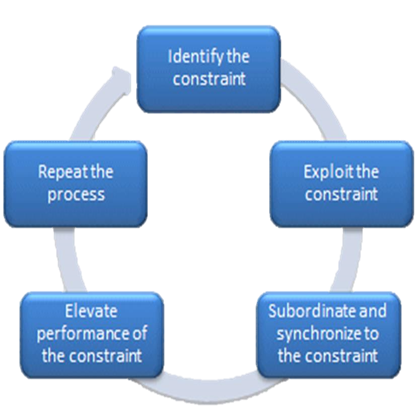
In our first blog, we provided a summary of TOC, Theory of Constraints and dove into Step #1: Identify the Constraint. We will continue this journey now in Step #2: Exploit the Constraint. Again, I will break down each step with the concept and a real-life example (I have many) to help bring you from concept to implementation.
Step 2: Exploit the Constraints. In this step, we have something that we NEED to do and something that we want to AVOID doing. Step 2 is where the DIG team does its best work and really shines, why? Because our team goal is “Creativity over Capital”. What does that mean? It means how can we make major improvements WITHOUT major investment. If you are successful in applying step 2 through your career, when you ask for money to be invested, your company should be excited to support the initiative. This is because our primary goal in Step 2 is to make improvements without investments…if you can show real gains with limited funds, when you ask for funds, it should be easier to justify. This is the heart of “Creativity over Capitol” and should be the foundation of all successful operations projects regardless of industry.
So how do we start Step 2, as we now know the bottleneck from Step 1, we need to start to attack it. Different industries require different approaches, but here we will discuss the 2 most common:
Approach #1 for Step 2: Cycle Time Analysis and Chip Charts. Here we take cycle times of each major element of the bottleneck station and identify the opportunities for improvement. Often, not all elements are set up in unison and there is room for improvement. By laying each major element of the station out and analyzing the time it takes to complete each step, you will identify opportunities to reduce the times of the slowest actions and reduce the overall time of the bottleneck to complete one full cycle.
Approach #2 for Step 2: OEE Analysis. By collecting loss data and bucketing these losses into breakdowns (major line stoppages), microstops (short delays that inhibit rhythm and routine) and quality (issues that must be repaired and affect the bottlenecks ability to produce). You can identify the largest contributor and apply various tools to attack the largest issue using pareto / 80-20 strategy to prioritize efforts and maximize results.
Clearly, both these approaches can be applied together or separately, this is up to the readers discretion, at this point you should know your systems better than anyone and how to improve them.
Step 2: Real life example: At an automotive OEM that I was asked to come work with, the bottleneck, identified in Step 1 of our TOC, pointed to the outer framing system. This is a common bottleneck throughout the automotive industry so no real surprise. When I arrived on the project, the plan was to add a second framing system for a cost of nearly $10M. They were in the final stages of justification when I stepped in to take a second look. By applying approach #1 in Step #2 of TOC and analyzing the cycle time of each critical task of this area, we identified 9 different improvements that could be made within the onsite team with essentially no investment. We spent the next several weeks implementing these projects and kept track of the results, which you can see in the chart below. In completing these projects, we were able to save over 5 seconds per cycle, which added enough throughput to break this bottleneck and avoid this significant investment.
Later, when we review Step 4, we did make investments in the plant in another bottleneck area and like I said earlier, it was very easy to justify to leadership. When you save them $10M, they are happy to hear your ideas to spend $2M instead to add even more capacity! Now, onto Blog #3!!!


Comments